
Key Insight: There are tangible, data-supported ways to make the survey experience more inclusive for participants without compromising the representativeness of the sample.
Making the survey experience as inclusive as possible for all participants is a very important priority for Market Research companies. Although we (at Touchstone) pride ourselves in always striving to make our survey experience, and our research processes in general, more inclusive for participants, we also recognize that there is still room to do better.
As a starting point, we focused on improving how we ask research participants about their race and ethnicity in our standard market research surveys. Our goal was to determine if there were better ways to ask our participants about their race and ethnicity; By “better” we meant ways that were more inclusive for participants without compromising the representativeness of our sample.
WHAT WE DID:
Touchstone Research designed and conducted a large-scale primary research project with real respondents to find data-supported ways to make our standard race and ethnicity survey questions more inclusive. Over the course of a month, 3,880 respondents completed a short multi-cell survey about a blinder topic (i.e., media awareness and usage) where we tested the impact of asking about race/ethnicity in three different ways:
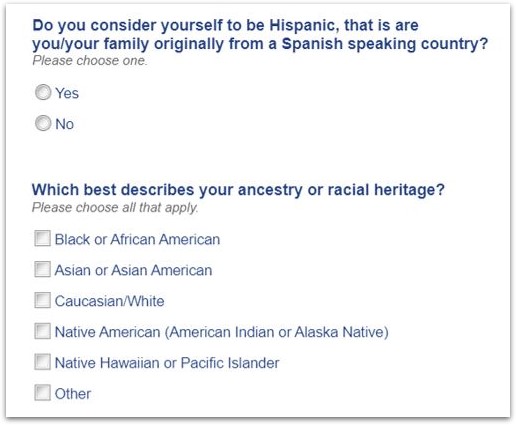
- Touchstone current format / Control (based on 2010 Census)
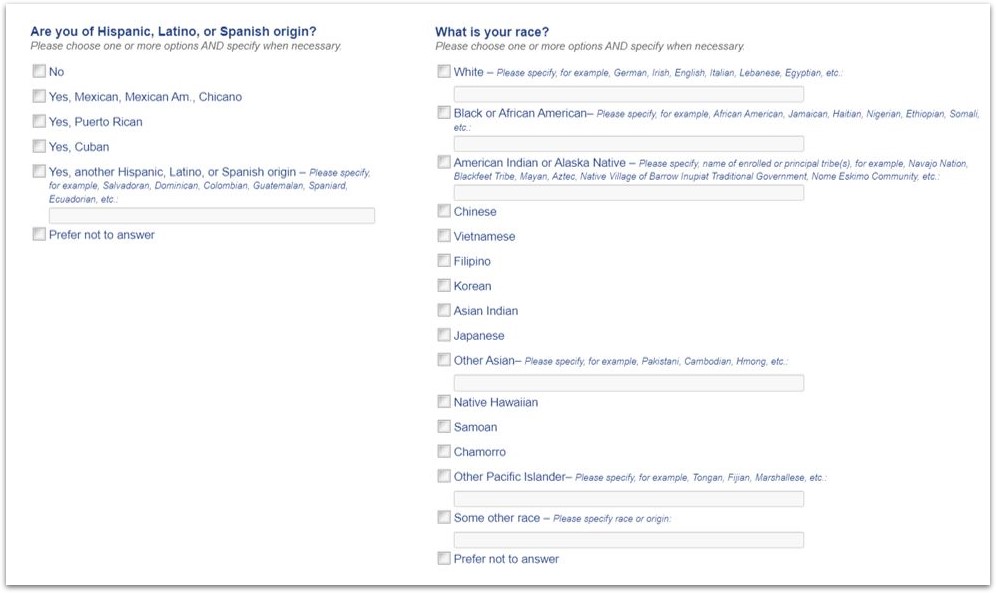
- 2020 Census format (includes expanded categories)
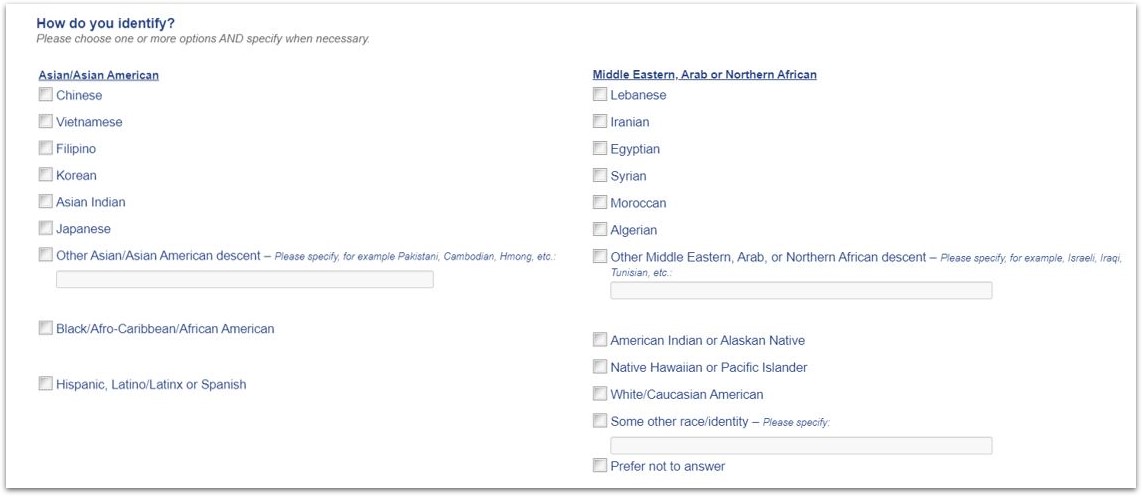
- Identity format (“how do you identify? / how do you most identify?)
CURRENT FORMAT (CONTROL)
2020 CENSUS FORMAT
IDENTITY FORMAT
We also included a 4th and 5th cell to test the impact of asking participants a combination of multiple question formats in the same survey.
The purpose of this project was to understand if participants answered race/ethnicity questions differently depending on how the questions were asked. Touchstone Research isolated the impact of the question format by including an equal number of participants of each race/ethnicity across all research cells. We were able to target our survey invites to ensure the sample was balanced by race/ethnicity across cells because all participants had been previously profiled on race/ethnicity (based on Touchstone’s current race/ethnicity question format).
WHAT WE LEARNED:
This project had many applicable findings that won’t be covered here, but the main take-away was that people do answer race and ethnicity questions differently based on how they are asked.
A few other key insights from our analysis:
- People’s race/ethnicity is not their identity. Participants answered differently when they were asked “How do you identify?” vs. “Do you consider yourself to be Hispanic? / What is your race?”
- How do you identify?” is a more inclusive way of asking people about their race/ethnicity than the standard two-question, Census based format (“Do you consider yourself to be Hispanic? / What is your race?). Significantly fewer participants selected “Prefer not to answer” when they answered the question “How do you identify?” vs. either version of the two Census based question formats.
- Asking Hispanics “How do you identify?” is a much more inclusive way of asking about their race than forcing them to choose one of the answer options in a standard Census based race question. In the Census based question format cells, participants answered a Hispanic origin question followed by a question about their race. Hispanics were much more likely than Non-Hispanics to select “Prefer not to answer” when they answered the standard Census based race questions. Also, over two-thirds of the participants who selected the “other race” answer option specified that they considered their race to be “Hispanic” or “Latino” in an open-ended response.
- Including more individualized and specific sub-categories in the answer options or question text (e.g., “Chinese, Japanese, Korean, Filipino, etc.” instead of just “Asian”) did not have a meaningful impact on how participants answered. We netted the sub-category results to match the broader categories that are typically included in these questions (e.g., Asian, Pacific-Islander, etc.) and the percentages of total participants in each category was very similar across cells.
- Finally, a notable portion of participants primarily identified as being multiracial. 6% of all participants selected the answer option: “Multiracial: I primarily identify myself as someone who has more than one race/ethnicity” when they were asked “Which race/ethnicity do you identify with most?” Only participants who had indicated they identify with more than one race/ethnicity were asked this follow-up question.
WAYS TO APPLY THESE FINDINGS TO SURVEYS:
Touchstone Research has formulated a few specific recommendations for how market researchers can apply these findings to their own surveys:
- Consider including the question “How do you identify?” where you would typically ask participants about their race/ethnicity to make your surveys more inclusive. This question does not have to replace any traditional Census based race/ethnicity questions that have been asked in past surveys, but it could provide valuable supplemental information and is more inclusive for participants. (We realize you may still need to include race/ethnicity questions that are more closely aligned with the US Census format to have confidence that your sample is nationally representative).
- Use the additional information about how participants identify to uncover new insights for your clients. If participants identify differently compared to how they answer standard race/ethnicity questions, it could provide a new market opportunity for your clients. At minimum, having this new information will add a layer of depth to any standard insights you provide to your client based on race/ethnicity
- Think about participants who primarily identify themselves as multiracial as a separate target demographic group. Add a new banner point called “Multiracial” to your standard banner plan so you can explore if/where there are meaningful differences between participants who primarily identify as “Multiracial” compared to participants who primarily identify with one race/ethnicity.
- Expand the answer categories in any race/ethnicity questions to include more region-specific sub-categories (e.g., “Chinese, Japanese, Korean, Filipino, etc.” instead of just “Asian”) to maximize representativeness and inclusivity. Expanding the categories will make the survey experience more inclusive because participants will have a better chance of selecting a race/ethnicity that reflects themselves accurately. This should also decrease the percentage of respondents who select the “Other” or “Prefer not to answer” answer options at these questions.
In summary, always looking for new ways to make the survey experience and overall research process more inclusive to all participants is a very important priority for us at Touchstone Research. We are proud that we were able to identify and share a few tangible, data-supported ways to make our survey experience more inclusive for participants by revising how we ask them about their race and ethnicity.
Thank you for reading. For more information, please reach out to us at [email protected]

Adam is a Research Manager at Touchstone Research with over 15 years’ experience designing and executing a wide range of primary quantitative research projects for industry leading media and technology companies, including Disney, Paramount, META and Google. Prior to joining Touchstone, Adam conducted media and technology research for clients at various other prominent market research companies, such as Nielsen, Ipsos, and NRG.