Like many other types of survey research, one of the main objectives of consumer research (and more generally, market research) is to map the human decision-making process. More specifically, it aims to understand what the most important considerations are when making a purchase so that products and services can be tailored to attract the largest number of potential consumers1. Over the past century a multitude of techniques have been developed to do just that. Some of those techniques are more powerful than others, and some of them are best suited only for specific situations. In this article, we examine eight of those techniques and impute 4 standardized performance metrics for them—length of time to complete, between-item discrimination, between-group discrimination, and predictive validity— to determine the optimal situations under which to use each.
Figure 1. Types of scaling techniques
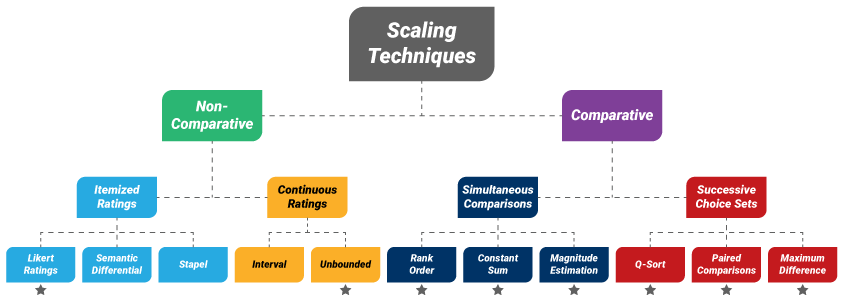
*Indicates technique is examined in this analysis
In general, there are two types of scaling techniques available to survey researchers: non-comparative (for which the respondents make no direct comparisons) and comparative (which require the respondents to compare two or more items at a time)2. In this article, we investigate two non-comparative and six comparative techniques (see Figure 1).
- Likert Ratings
- Unbounded Ratings
- Rank Order
- Constant Sum
- Magnitude Estimation
- Paired Comparisons
- Q-Sort
- Maximum Difference (MaxDiff)
Please note, the other techniques in Figure 1: semantic differential, Stapel, and interval ratings—are not examined here due to their lacking of numerical performance metrics in existing literature.
Non-Comparative Scaling Techniques
The non-comparative techniques are ratings scales, requiring respondents to assign each item an importance rating without directly comparing any of them.
Itemized Ratings: The most common type of itemized rating technique consists of a set of items, usually in the form of a grid, on which the respondent is asked to rate how important each item is when making a purchase decision on a specific scale. This scale is usually a Likert scale with 5, 7, or 10 values for which the lowest value indicates the lowest level of importance, and the highest value indicates the highest level of importance.
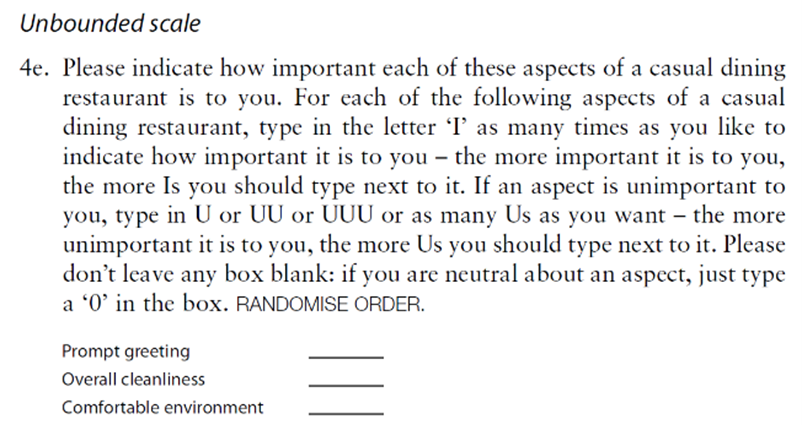
Continuous Ratings: In contrast, a continuous rating scale has no fixed values, as is the case for an unbounded ratings scale. For this technique, respondents are instructed to insert as many I’s (for ‘important’) or as many U’s (for ‘unimportant’) as they feel necessary for each item, or 0 if totally indifferent toward an item. To correct for the potentially wide distribution of ranges, each of the assigned values is divided by the largest value given by the respondent, in absolute value terms (See Figure 2 for an example of this type of question in a survey).
Figure 2. Example of a survey question utilizing unbounded ratings3
Comparative Scaling Techniques
Rank Order: One of the most basic comparative scales is rank order scaling. For this technique, a set of N items is presented to respondents with instructions to rank them from 1=’most important’ to N=’least important’ when making a specific decision. For ease of execution on the part of respondents, it is generally recommended that N be no greater than ten4,5.
Constant Sum: Another relatively simple technique is constant sum scaling. Unlike rank order scaling, which has fixed values, constant sum scaling requires respondents to allocate a number to each of the N items (the larger the number, the more important the item) so that the sum of the N numbers equals a prespecified value, usually 1003,6.
Magnitude Estimation: Somewhere in between the fixed value rank order scaling and non-fixed value constant sum scaling is magnitude estimation: For this technique, one item is randomly selected from a list of N and assigned a specific value, serving as an anchor. The respondent is then asked to assign the rest of the items a value relative to that anchored item (i.e. if an item is twice as important, the respondent would assign twice the anchored value, and if it was half as important, the respondent would assign half of the anchored value). To correct for the potentially wide distribution of ranges, each value is typically log-transformed7,8.
The three other comparative techniques are Q-sort, paired comparison scaling, and maximum difference scaling (MaxDiff). These three techniques require the respondent to choose items in successive comparative sets:
Q-Sort: For Q-sort, items are classified into a quasi-normal distribution. For example, a set of N=10 items is shown to the respondent, and the respondent is asked 4 successive questions: “What is the most important item?”, “What are the next (2) most important items?”, “What is the least important item?” and “What are the next (2) least important items?” and those selected items are assigned values of 2, 1, -2 and -1, respectively. The remaining four items are assigned a value of 0, thus completing the quasi-normal distribution. Q-sort is a mixed method, both qualitative and quantitative in nature9.
Paired Comparison: Another set-based technique is paired comparison scaling. This technique can have a significantly greater number of comparison sets, but each set contains a very simple choice between 2 items. More specifically, in the full model, the respondent is presented with N(N-1)/2 separate pairs (i.e. all of the possible pairs of items) and is asked to select which item from each pair is more important. For large N’s, however, a fractional model (showing a subset of all possible comparisons) is typically adequate10,11.
Maximum Difference: And finally, for maximum difference (MaxDiff) scaling (also known as best-worst scaling), the researcher chooses the number of sets the respondent will see. For N total items, the number of items in each set (y) is also chosen by the researcher, but is recommended for best practice to be three, four or five. And, if the researcher wants the respondent to see each item z times overall, the number of sets required is z x N/y; again, for purposes of best practice, z=3 is typically recommended. For each set, the respondent is asked to choose which item is most important to them and which item is least important. Finally, the results of the choice exercise are analyzed (typically a hierarchical Bayesian multinomial logistic regression) and each item is assigned a continuous ratio value known as a utility score3,12
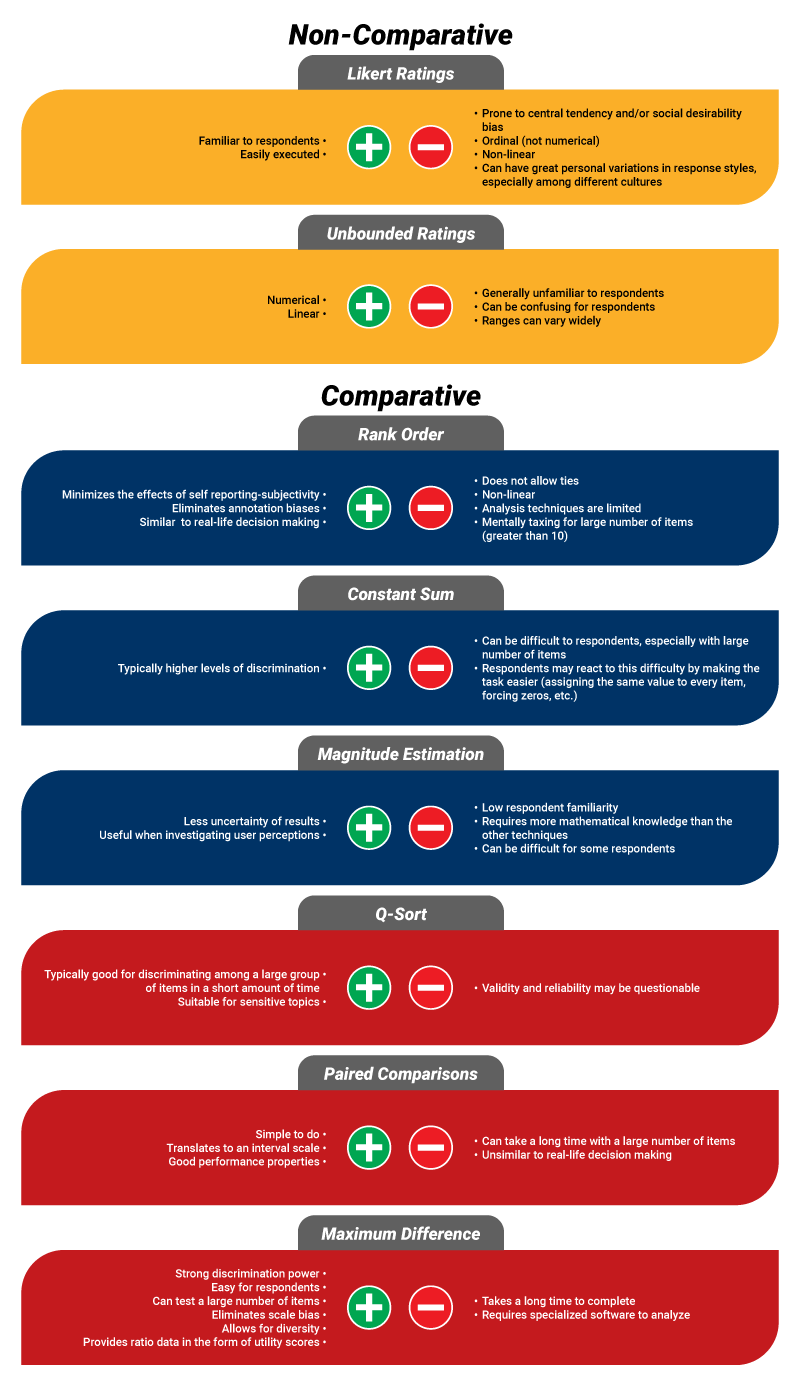
Figure 3. Pros and cons of using each of the 8 scaling techniques
Comparisons of Performance Metrics
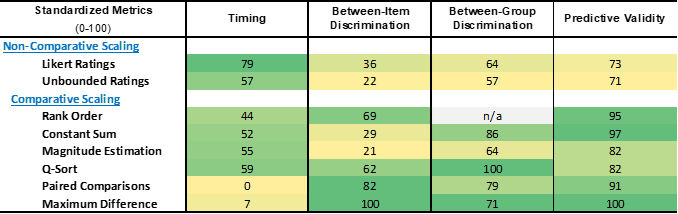
Using data from five different sources3,11,13,14,15, metrics on time to complete, between-item discrimination, between-group discrimination, and predictive validity for each technique are retrieved and standardized to a 0-100 scale for purposes of comparison. For all four metrics, higher scores indicate better performance, including time to complete (i.e. a higher score indicates a shorter time interval).
Time to Complete: As seen in Table 1, the fastest technique to complete is the Likert scale ratings, while paired comparisons takes nearly 4 times as long.
Between-Item Discrimination: Maximum difference has the best between-item discrimination, while magnitude estimation and unbounded ratings discriminate the least.
Between-Group Discrimination: Q-sort performs best at discriminating between groups of respondents while unbounded ratings scaling again discriminates the least..
Predictive Validity: And finally, maximum difference scaling has the highest predictive validity while the two non-comparative techniques (Likert and unbounded ratings scaling) have the lowest.
Table 1. Standardized performance metrics of the 8 scaling techniques
Optimal Circumstances for Using Each Method
Based on the performance metrics, it is clear that non-comparative scaling techniques do not perform as well as their comparative counterparts.
Ratings scales are best used in conjunction with a comparative technique (for extra validation) as well as for market segmentation. Generally, Likert scale ratings should be considered over unbounded ratings because of their familiarity to respondents (yielding a faster time to complete), better between-item discrimination, and slightly better between-group discrimination.
Magnitude estimation also performs relatively poorly compared to other options and is best suited when you are seeking a deep investigation into user perceptions (mainly because it is one of only two techniques with no restrictions on value ranges greater than zero, the other being unbounded ratings).
Among the higher performing options…
Constant sum scaling should be used when you need a relatively quick technique to make predictions.
Q-sort should be performed when you need to a quick technique to evaluate differences between groups.
Rank order scaling should be used when you need a quick technique and between-item discrimination is critical, like when determining what the most important attributes are when making a specific purchase decision.
This leaves us with the two most time-consuming techniques, Paired Comparisons and MaxDiff. When the length of execution time is not an issue…
Maximum Difference scaling should be the technique of choice if you have access to the necessary analysis software (e.g., Sawtooth, R) or are working with a research partner, like Touchstone Research that can design and analyze MaxDiff results.
Paired Comparisons is a good option if you don’t have access to the necessary software (and are not working with a research partner like Touchstone Research).
Each of the techniques has its unique set of advantages and challenges and prove to vary in performance by different research need-states. To optimize the value of consumer research, these differences should be carefully weighed when deciding how to best model purchase decision-making processes.
Quantitative Research Expertise
As any researcher knows, the quality of the survey instrument/questionnaire is one of the most critical pieces towards unlocking the highest quality of insight for a research project. Without a solid questionnaire at its foundation, a research project is likely doomed to sub-par insights. Our in-house team of quantitative analysts and project directors are true experts in designing, fielding, and analyzing quantitative research projects across a wide range of methodologies. We know what questions and scales to use, what flow to follow, and what language/terms to use for all audiences (including preschoolers, kids, and teens) to help our clients get the most from their research projects. Our expertise includes everything from content/pilot testing to culture research to UX, and everything in between. Need help designing, fielding, or analyzing your next quantitative research project? We would love to connect and discuss how we may be able to help! Drop us a line at [email protected].

White Paper Prepared by: Michael Kozloski – Senior Research Analyst
Michael is a Senior Research Analyst with over 15 years of professional experience conducting quantitative market and social science research. While he is highly experienced with all phases of the quantitative research process and has led numerous studies across a wide range of methodologies, his area of particular expertise is in data preparation and analysis, with a key component being data merging and meta-analyses.
Sources
- Jaeger, S., Jørgensen, A., Aaslyng, M. & Bredie, W. (2008). Best–worst scaling: An introduction and initial comparison with monadic rating for preference elicitation with food products. Food Quality and Preference, 19(6), 579-588. doi:10.1016/j.foodqual.2008.03.002.
- Malhotra, N. & Birks, D.F. (2007). Measurement and scaling: fundamentals, comparative and non-comparative scaling. Marketing Research: An Applied Approach. 334-368.
- Chrzan, K., & Golovashkina, N. (2006). An empirical test of six stated importance measures. International Journal of Market Research, 48(6), 717-740. doi:10.1177/1470785306048006
- Yannakakis, G.N. & Martínez, H.P. (2015). Ratings are overrated! ICT, 2, 2:13. doi:10.3389/fict.2015.00013
- Ranking questions vs. rating questions. Verint. (2022, November 2). Retrieved January 10, 2023, from https://www.verint.com/blog/ranking-questions-vs-rating-questions/
- Comparative scales. Questionstar. (2021, August 9). Retrieved January 14, 2023, from https://www.questionstar.com/textbook-principles-of-survey-research/survey-measurement-and-scaling/comparative-scales/
- Fukuda, S., Goodall, G., Michel, M. & Beecher, H. (2012). Is magnitude estimation worth the trouble? Proceedings of the 29th West Coast Conference on Formal Linguistics, ed. Jaehoon Choi et al., Somerville, MA, pp. 328-336.
- Turpin, A., Scholer, F., Mizzaro, S. & Maddalena, E. (2015). The benefits of magnitude estimation relevance assessments for Information retrieval evaluation. In Proceedings of the 38th International ACM SIGIR Conference on Research and Development in Information Retrieval (SIGIR ’15). Association for Computing Machinery, New York, NY, pp. 565–574. doi:10.1145/2766462.2767760
- Bashatahl, L.S. (2016). Q-methodology: What and how? IOSR Journal of Research & Method in Education (IOSR-JRME), 6(5), 37-43. doi:10.9790/7388-0605053743
- Madansky, A. (2022, September 16). Data use: Evaluating paired comparisons, maximum difference and traditional ranking: Article. Quirk’s Media. Retrieved January 10, 2023, from https://www.quirks.com/articles/data-use-evaluating-paired-comparisons-maximum-difference-and-traditional-ranking
- Cohen, S., & Orme, B. (2004). What’s your preference? Asking survey respondents about their preferences creates new scaling decisions. Marketing Research, 16(2), 32-37.
- Mora, M. (2021, November 9). Making the case for Maxdiff. Relevant Insights. Retrieved January 10, 2023, from https://www.relevantinsights.com/articles/making-the-case-for-maxdiff/
- Cohen, S. (2003). Maximum difference scaling: Improved measures of importance and preference for segmentation. Sawtooth Software Conference Proceedings. San Diego, CA, 61-74.
- Crits-Christoph, P., Gallop, R., Diehl, C.K. & Yin, S. (2017). Methods for incorporating patient preferences for treatments of depression in community mental health settings. Adm Policy Ment Health, 44, 735–746. doi:10.1007/s10488-016-0746-1
- Lee, A., & Lind, M. (n.d.). A practical look at alternatives to traditional importance measures. YouGov DefinitiveInsights. Retrieved January 11, 2023, from http://cdn.yougov.com/cumulus_uploads/document/w48tgcwndp/A_Practical_Look_at_Alternatives.pdf